JOEL M. KAUFFMAN
Emeritus, Department of Chemistry & Biochemistry,
University of the Sciences in Philadelphia, PA 19104-4495
e-mail: [email protected]
Journal of Scientific Exploration, Vol. 21, No. 4, pp. 723–749, 2007 0892-3310/07
Abstract
Claimed human-caused warming of the Earth to dangerous and unprecedented levels by human-related emissions of carbon dioxide is contradicted mainly by a non-correlation of carbon dioxide levels with warming.
Details are given of misleading proxy temperature reconstructions, as well as of misleading proxy atmospheric carbon dioxide concentrations. Evidence is presented to show that trepidation about runaway land surface temperatures should apply only to giant urban heat islands, not to rural areas or oceans.
Evidence is presented for causes in addition to human emissions for changes in the levels of atmospheric carbon dioxide, namely its emission from warming oceans. Plausible alternative causes of surface temperature change are given as well, including variations in solar output and cosmic ray intensity.
When you have eliminated the impossible,
whatever remains, however improbable,
must be the truth. —Sir Arthur Conan Doyle, 1887
Introduction
Anthropogenic Global Warming (AGW) Hypothesis
The AGW Hypothesis states that sunlight radiation warms the Earth by being absorbed at its surface. Then some of the absorbed heat is reradiated into the atmosphere. Some gases in the atmosphere, called ''greenhouse gases'', absorb much of this heat, and then reradiate it, some toward the surface of the Earth, making the Earth warmer than it would be without a heat-absorbing atmosphere.
The primary ''greenhouse gas'' by far is said to be carbon dioxide (CO2), with some hints about methane (CH4), ozone (O3) and traces of halocarbons. The greenhouse effect is also likened to the temperature rise in a car parked in sunlight. The AGW Hypothesis rests on the common representation of ground temperatures as being fairly constant on an annual basis from AD 1000–1900 and rising exponentially since, just as CO2 levels are also commonly represented to do, to give a claimed ''near-perfect'' correlation.
The least pejorative common nickname for promoters of AGW is ''Warmers''. Reports from the Intergovernmental Panel on Climate Change of the United Nations (IPCC) in 1990, 1995, 2001 and 2007 are the most ''official'' sources of support for the AGW Hypothesis. Large numbers of scientists contribute, and their combined opinion is said to represent a consensus among climatologists.
The AGW Hypothesis is taught in grade schools, Sunday schools and colleges as fact, and is found in many textbooks in many subjects.
Solar Output Variation Hypothesis
Many serious scientists cite evidence that variations in solar output, solar distance and number of sunspots are primarily responsible for temperature changes on Earth. Various cycles from 21 years to 1500 years have been noted (Alexander et al., 2007; Singer & Avery, 2007). The group of serious scientists includes about 20,000 in all who have expressed doubts or disbelief in the AGW Hypothesis. This includes 19,000 signers of a petition from the Oregon Institute of Science and Medicine (1998 and after), all with degrees in science or engineering, and includes 2600 with climate science credentials. Signatures may be viewed at http://www.oism.org/ using the link: ''Global Warming Petition Project''. In 1997 fully 90% of State Climatologists did not agree with the AGW Hypothesis (Singer & Avery, 2007: 65–66).
The least pejorative common term for those who do not accept the AGW Hypothesis is ''Climate Skeptics'', which will be shortened to ''Skeptics'' in this work.
Radioactivity and Volcanism
Either Warmers or Skeptics may accept that primordial ionizing radiation from within warms the Earth. Also, there is little argument that volcanic action, especially under the ocean, warms the Earth, or that volcanic dust in the atmosphere can cool the Earth by increasing its albedo, as can particulate pollution.
Falsifying a Hypothesis
Many times in JSE one can find the scientific precept that few hypotheses can be proved, but any can be disproved by a single example of evidence in disagreement with the hypothesis. Many examples of such disagreement will be given.
Linus Pauling's 1965 chemistry text would seem to disagree with the AGW Hypothesis:
''There are great amounts of carbon dioxide, in combined form, in the sea and in rocks. Sea water contains about 0.15% of its weight in carbon dioxide, mainly as hydrogen carbonate ion, HCO3_. The amount of carbon dioxide contained in sea water is about 65 times as much as that in the atmosphere. Under changed climatic conditions large amounts of carbon dioxide might be released from the oceans, increasing the concentration in the air. It is probable that there were larger amounts of carbon dioxide in the atmosphere during the Carboniferous Period than at the present time, permitting plant life to flourish and the great coal beds to be laid down.'' (Pauling, 1965: 335)
Sources
Where possible, citations to peer-reviewed literature, or to books which cite such sources, will be used. Because of the existence of a research cartel and media control in this field (Bauer, 2004), the readers' forbearance in my use of websites and non-refereed sources is requested.
An example of non-scientific pressure in the climate field is the firing of six editors by the publisher of the journal Climate Research because they published a literature review on long-term temperature proxy studies (Soon & Baliunas, 2003). The review included several studies in which contrary results were found, with regard to the great majority of studies cited. Thus the review did not selectively cite only studies with a desired result and was unbiased. The firings were reported by Zbignew Jaworowski, MD, Ph.D. (2007). Other prominent journals now routinely refuse to publish papers that do not support AGW.
Correlation of Atmospheric Carbon Dioxide Levels
with Global Temperatures
Ground Stations, 1940–1970.
All temperatures are in degrees Celsius (C).
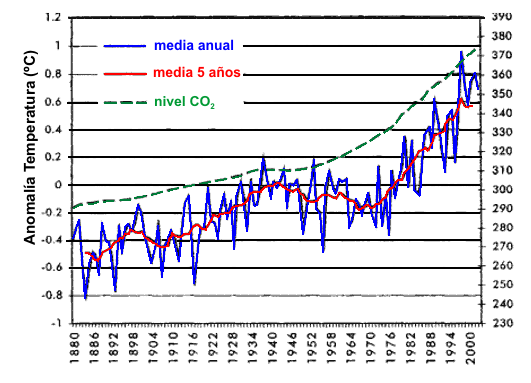
In Figure 1 the commonly presented values for global temperatures for the period 1940–1978, based on the readings of thermometers or equivalents at 1 to 2 m above ground level, are used to make the case for correlation with CO2 levels, and these are the ones used by the Goddard Institute for Space Studies (GISS, Columbia University, New York, NY; GISS is a laboratory of the Earth Sciences Division of the National Aeronautics and Space Administration [NASA]). In this graph CO2 concentrations are shown as steady at 310 ppm from 1940–1948, then rising at an increasing rate through 1970. Land temperatures are shown vs. a base year of 1940 Ľ 08, as falling erratically by 0.178 by 1970.
Since these ground-station temperatures were contaminated by urban heat island effects, to be described later, the actual rural temperature drop was greater. Note that there is no correlation whatsoever with CO2 levels. The slight increase in temperatures from 1952–1961 is not accompanied by any concurrent change in the rate of rise in CO2 levels. Many Warmers have tried to explain this as a cooling effect of sulfate aerosols from the burning of sulfur-containing fuels. This does not make overall sense because such burning did not suddenly begin in 1940 or diminish in 1970.
Others point to volcanic activity, the dust ejections of which also cool the troposphere by reflecting sunlight (Robock, 2000). The effect of an extremely large eruption normally lasts 1–3 years, not 30 years. After the eruptions in Indonesia in 1815 and 1883 there were reports of ''the year without a summer'', not the ''30 years without a summer'' (Table 1).
Tambora's eruption in 1815 lowered temperatures in much of the world by about 18, and Krakatoa's eruption in 1883 lowered temperatures by about 0.68, both for under a year (Winchester, 2003). Moreover, there was only one big eruption in the 1940–1970 period, also from Indonesia, in 1963. This could not explain the drop in temperature from 1942–1952. Nor could volcanism explain the temperature drop of 0.158 from 1897–1908, as indicated in Figure 4.
Satellites and Tropospheric Temperatures, 1978–2007
Since late 1978 satellites have been used to measure tropospheric temperatures by looking sideways through the atmosphere. Unlike ground stations, these satellites cover a major portion of the Earth, including a major part of the surface that is ocean. Microwave Sounding Units on National Oceanic & Atmospheric Administration (NOAA; of the U.S. Department of Commerce) polar orbiting satellites have measured the intensity of upwelling microwave radiation from atmospheric oxygen. The intensity is proportional to the temperature of broad vertical layers of the atmosphere, as demonstrated by theory and direct comparisons with atmospheric temperatures from balloon-borne radiosonde profiles. Since temperatures from satellites are not measured directly, and because data processing of some complexity must be done, the agreement with direct readings from balloons is very important. Because of the agreement, at the very least, the relative readings are believable (Figure 2). Spencer and Christy of the University of Alabama, Huntsville, find an overall increase of 0.054 6 0.078 per decade in this record, while others see larger values (Christy et al., 2007).
Fig. 2. CO2 concentration in ppm in atmosphere (upper line, right scale) from 1979–2007 vs. monthly mean mid-troposphere temperatures (jagged line, left scale). Available at: http:// www.junkscience.com/MSU_Temps/UAHMSUglobe-m.htm. Accessed 24 July 2007.
The CO2 record runs from 335 ppm in 1978 to 385 ppm in 2007 (Figure 2). In this period all CO2 data is from Mauna Loa and is determined by a nondispersive infrared (NDIR) method. The annual waviness in the upper line representing CO2 is due to seasonal fluctuations. The fact that the values are higher in the summer and lower in the winter may due to higher solubility of CO2 in sea water in winter than in summer. Note that the peak temperature in 1998 was not concurrent with or preceded by any sudden or abnormal rise in CO2 levels for the previous 20 years on the graph. Note that the temperature drops of 1984, 1989, 1993, 1999 and 2003 were not concurrent with or preceded by any corresponding drop in CO2 levels. Moreover, every year since 1998 has been cooler, despite a supposed ever-increasing rise in CO2 levels. So here, too, there is no correlation whatsoever.
In these recent years some ground-station results on temperature agree with the atmospheric measurements. At the website of the University of East Anglia (UEA, 2007) the annual mean temperature departures from the base year of 1985 were found and graphed (Figure 3).
Fig. 3. Global cooling since 1998 shown as temperature departures from the baseline year of 1985 from ground stations uncorrected for urban heat island effects. Constructed from tabular data available at: http://www.cry.uea.ac.uk/cru/data/temperature/hadcrut3vgl.txt. Accessed 12 February 2007.
The drop in temperature after 1998, a rise through 2003, and drops in 2004 and 2006 all agree well with the satellite data. All years since 1998 have been cooler. Prof. John Mitchell, OBE FRS, Chief Scientist at the Met Office of the UK, showed that satellite records could be reconciled with ground-station records (Mitchell, 2007). And there were no big volcanic eruptions in the late 1990s (Table 1).
Ground-station results from 27 rural locations in Australia show a mean temperature of 17.38 in 1880, dropping irregularly to 16.78 in 1946, then rising irregularly to 16.98 in 1990, an overall move of minus 0.48 in 110 years. Of course, there is no correlation with CO2 levels (Endersbee, 2007a).
If the AGW Hypothesis is correct, the CO2 in the atmosphere must absorb infrared radiation from the Earth's surface. This increases the amplitude of molecular vibration, another way of saying that the CO2 molecules warm up. Any such vibration would be communicated and shared with all the other gas molecules in the air. If this happened, the warmer air could warm the surface by reradiating infrared or by convection/conduction. However, the balloons and satellite (Figure 2) data do not show more than a 0.148 warming of the atmosphere from 1978–2007, while ground temperatures are claimed by the GISS to have risen 0.88 in this same period (Figure 4). How could the surface temperature rise more than the atmospheric temperature if the latter is hypothesized to have warmed the former?
Fig. 4. Global temperature (left scale) from ground stations vs. CO2 concentration in ppm in atmosphere (right scale) from 1880–2003. Available at: www.GISS.NASA.gov. Accessed 2003.
This disparity was noticed independently by others, including S. Fred Singer, PhD, Physics, Princeton University, whose letter to Nature was rejected, naturally, one must now say. He noted that expected tropospheric warming in the tropics was not observed. The letter is available on the internet at blogs.nature.com/news/blog/2007/02/climate_report.html (Jaworowski, 2007). Singer was the first Director of the U.S. National Weather Satellite Service, and the founder of The Science & Environment Policy Project (SEPP, a non-profit founded in 1990).
The most likely temperature rise of the Earth's land surface in the entire 20th century is about 18 (Michaels, 2004: 52), ignoring Australia (see below). Another estimate is ţ0.58 (Robinson et al., 2007). There is a poor correlation with CO2 levels.
Flaws in the Temperature Record
Medieval Warm Period, '800–1300
From New Scientist (Brahic et al., 2007) comes the following: ''Myth: It was warmer during the Middle Ages than it is now, with vineyards in England''. ''There are now a dozen or so temperature reconstructions for the northern hemisphere that go back beyond 1600. These studies show periods of unusual warmth from around AD 900 to 1300, but the details vary''. These two statements are contradictory. Ten temperature graphs are shown superimposed, one being the ''hockey stick'' of Michael Mann from 1999, which is still the most widely disseminated long-term temperature graph. Except in the period from 1890–2000, the graphs do not agree with each other. While the graphs do not agree in the AD 900–1300 period, none shows a temperature in that period that is as high as shown for the year 2000.
Mann's work appears to be an outlier in the period from 800–1300 in claiming the absence of a medieval warm period, since only 5 other studies are in near agreement. Fully 109 studies cited in a 2003 review found a medieval warm period! Nine of these studies were worldwide or over a wide region, and 5 were in the Far East. Many types of proxies were used in this pre-thermometer era, including bore holes, literature, glacier retreat, isotopic changes in sediments, ice cores, pollen counts, shifting tree line positions, and many others (Soon & Baliunas, 2003). Clearly the New Scientist article and many that agree with it have a goal other than sound science. Such a goal would be achieved by showing errors in most of the 109 studies, citing every one; this was never done.
Good science is not accomplished by simply ignoring findings at odds with the desired ones.
Little Ice Age, 1300–1900
In Brahic et al. (2007), Mann's ''hockey stick'' does not indicate a Little Ice Age, but the proxy graph based on glacier lengths by J. Oerlemans (2005) does, with a low temperature in 1580 that is 0.98 lower than that of 1950. This is a good time to address the pronounced melting of glaciers in recent times. From 1700–1825, 5 to 12 glaciers gained in mean length (Figure 5). From 1825–1975, 12 to 169 glaciers became shorter, then shortening diminished until 1998, then a 730 J. M. Kauffman divergence between Alps and non-Alps glaciers appeared. The non-Alps glaciers increased in length after 1998. Fully half of the glacier length retreats took place between 1825 and 1906, before CO2 levels were supposed to have increased.
Fig. 5. Glacier lengths of up to 169 glaciers in northern hemisphere from 1700–2000. Adapted from Oerlemans (2005). Used with permission of AAAS Science.
Alarms have been raised about loss of ice from Antarctica. According to Singer and Avery (2007: 12), only the Antarctic peninsula pointing toward South America is warmer, while the other 98% of Antarctica is cooling.
The Soon and Baliunas (2003) review also asked the question ''Is there an objectively discernible climatic anomaly during the Little Ice Age interval (1300–1900) in this proxy record?'' Of the 122 studies that included this period, 2 did not find any anomaly, 2 were equivocal, and 118 did find that this was a cool period with lower temperatures than in the 20th century.
The claim by the IPCC (2007) and many others that pre-industrial CO2 levels were a steady 290 ppm is utterly non-correlated with the lower temperatures of the Little Ice Age or the higher ones of the medieval warm period. The actual CO2 levels, at least from 1810–1965, will be presented in the next section.
Present Warm Era, 1900–2007
In Brahic et al. (2007) only 2 of 12 temperature graphs showed a leap of 0.78 from 1975–2000; the others showed little change or ended too soon. J. Oerlemans (2005) constructed a proxy temperature chart from glacier lengths that was too recent to be in the Soon and Baliunas (2003) review. Fully 0.58 warming globally was calculated in the 1900–1950 period, and only 0.28 was calculated in the 1975–1990 period. This is totally non-correlated with the supposed CO2 values. Addition of an 0.18 warming from 1990–2007, as in Figure 2, gives a total of 0.88 for the 1900–2007 period, in fair agreement with Michaels (2004) above. This is not in agreement with ground-station data as commonly disseminated (Figure 4).
The Soon and Baliunas (2003) review also asked the question ''Is there an objectively discernible climatic anomaly within the 20th century that is the most extreme . . . [warmest] . . . in the record? [from 800–2002]''. Of the 104 studies that address the period, 74 did not find one; 10 did, but with the temperature maximum n the 1920–1950 era; and 2 found a maximum in the 1950–2002 period.
Devoid of urban heat islands and carbon dioxide sources, the Arctic Ocean surface temperature dropped 2.08 and the atmospheric temperature at 1.4 km altitude gained 1.08 as found from over 27,000 measurements by means of dropsondes used by USA aircraft flying from Alaska and radiosondes at Russian drifting ice stations during 1950–1990 (Kahl et al., 1993). Carbon dioxide rose by 16% during this period (Fig. 4).
NASA's Dr. James Hansen's flawed U.S. ground-station (48 states) temperatures from 2000–2006 needed a Y2K correction, provided around 7 August 2007 by the Canadian Steve McIntyre. This showed that 1934 was the warmest year of the last 100, not 1998 or 2006: http://data.giss.nasa.gov/gistemp/graphs/Fig.D.txt, first accessed on 14 August 2007, a rapid posting for which NASA deserves credit. The annual correction of minus 0.158 seems small, but note another comparison: 1921 was warmer than 2006 despite the far greater contribution of urban heat island effect in the later year. The decade of the 1930s had a deviation from the base period of ţ0.508, while the 1990s had one of ţ0.428, so even on a decadal basis the 1930s were warmer than the 1990s.
The widespread dissemination of data showing a scary leap in ground temperatures from 1975–2007 (Figure 4), accompanied by dire predictions of worse to come, is doubly flawed: (1) there is no consistent correlation between 20th century CO2 levels and temperatures, and (2) the supposed jump in ground temperatures between 1975 and 2007 is exaggerated by the ''urban heat island'' effect. Michael Mann's temperature ''hockey stick'' that was featured in the 2001 IPCC Report, with the leap in temperature from about 1900–1998, went quietly missing in the 2007 IPCC Report, yet many Warmers still scare audiences with it. Such serious flaws were found in Mann's work that Mann was made to publish a correction in Nature in 2004 (McIntyre & McKitrick, 2005).
But the fourth IPCC Report still insists that the latter half of the 20th century was the warmest period in the last 1300 years (IPCC, 2007).
Urban Heat Island Effect
Land that is built upon or paved never has the cooling effect of water evaporating; water runs off into sewers or streams. Winter heating, which may involve underground steam pipes as well as the individual house and building heaters, keeps cities warmer than their suburbs, as do idling vehicles. Summer air conditioning, which is about 50% efficient, throws twice as much heat into the atmosphere from refrigerant condensers as the heat removed. The problem is that very long-term ground stations with thermometers have often been increasingly surrounded by growing urban areas, thus giving increasing readings that are due to local human activity. Warmers insist, nevertheless, that the ground (near-surface) temperatures they present are corrected for urban heat island effects.
Actually, there is some evidence for biased selection of temperatures from more urbanized areas. From about 110 weather stations in California, the median increase from 1910–1989 was 0.308. The 6 stations selected by GISS for a global temperature compilation had a median increase of 0.458 (Christy & Goodridge, 1995).
Also from California stations, a striking temperature dependence was found depending on the population of the county in which the temperature station was located (Figure 6). In counties of under 100,000 inhabitants, the increase from 1909–1995 was 0.48 (not exciting); in counties of 100,000–1,000,000 inhabitants, the increase from 1909–1995 was 0.88; in counties of over 1,000,000 inhabitants, the increase from 1909–1995 was 2.38 (gets your attention) (Goodridge, 1996).
Fig. 6. Urban heat island effect: Warming trends from 1910–1995 in California ground stations. Top curve from counties with populations of .1 million people; middle curve from counties with populations between 0.1 and 1 million people; bottom curve from counties with populations of .0.1 million people. From Goodridge (1996).
The website www.GISS.NASA.gov provided long-term ground-station temperatures from thermometers for a number of locations, as shown in Table 2.
The selection was formed by combining a wide geographical area and the ''longest'' records that could be found. As can be seen, only the very large cities of New York (ţ4.48) and Tokyo (ţ3.18) warmed up enough to get your attention, as well as Pasadena (ţ3.48), which was surrounded by a growing Los Angeles County population. These urban heat islands do not represent global temperatures.
Many temperature graphs presented by Warmers often begin in the 1950s–1970s, a cool period (Figures 1 & 4); thus, they are misleading compared with the longer time spans in Table 2.
The overall temperature drop from 1880–1990 of 0.48 in rural Australian ground stations was described above. From the same source, the mean temperatures from 6 Australian cities, state capitals, rose from 16.58 in 1885 to 17.78 in 1990, a change of ţ1.28 (Endersbee, 2007a).
Flaws in the Carbon Dioxide Record
Greenhouse Gases: Which Are Important?
The term ''greenhouse gases'' is thrown around so often, and yet the only gas on which Warmers are fixated is CO2. Sometimes methane (CH4), refrigerants such as CClF3, ozone (O3) and others are mentioned. The composition of air in chemistry textbooks is nearly always given based on dry air, thus fails to include water vapor (Kauffman, 2004). Draconian limitations on CO2 emissions are proposed by Warmers.
TABLE 2
Temperature Changes at Various Locations
From Ground-Station Thermometers,
According to www.GISS.NASA.gov (in Crichton, 2003)
Location
Dates
DT(şC)
Alice Springs, Australia
1879–2003
0.0
Christchurch, New Zealand
1864–2003
0.1
Punta Arenas, Chile*
1888–2004
–0.7
Clyde, NWT, Canada
1943–2004
–1.0
Kamenskoe, Siberia
1949–1998
0.2
Göteborg, Sweden
1951–2004
0.2
LeBourget, Paris, France
1757–1995
–0.2
Milano-Linate, Italy
1763–1986
–0.1
Rome, Italy
1811–1989
–0.2
Stuttgart, Germany
1792–1999
–0.4
Lahore City, Pakistan
1876–2003
0.5
Takayama, Japan
1900–1990
0.6
Choshi, Japan
1887–2004
0.8
Tokyo, Japan
1876–2004
3.1
Death Valley, CA
1933–2000
0.4
Berkeley, CA
1930–2000
0.7
Pasadena, CA
1930–2000
3.4
Albany, NY
1820–2000
–0.6
West Point, NY
1826–2000
0.1
New York, NY
1822–2000
4.4
*Nearest to Antarctic Peninsula.
Not knowing whom to believe 8 years ago, I determined an infrared spectrum of humid summer air in Philadelphia, PA, finding that 92% of the absorption was due to water vapor, 8% to CO2, and none to methane (Figure 7). The instrument, a modern FT-IR, was operated in absorbance mode so that the area of the curve would be proportional to the concentration of gas present. Nature was kind in that the multiple absorptions of methane, CO2 and water are well-separated. The Earth's thermal (infrared) emission at 3–30 lm (Masterton & Hurley, 1989) broadly peaks near 500 cm_1 (20 lm), so the long-wave absorptions may be more important than their amplitude indicates. The mean water vapor content of the troposphere in the populous latitudes of the Earth is about 15,000 ppm.
Adding liquid and solid water, the total could be 20,000 ppm, dwarfing the contribution of CO2 at '385 ppm (Kauffman, 2004).
Even greater contribution of water vapor compared with CO2 would be seen all year long in the tropics, since the vapor pressure of water increases greatly with temperature. Conversely, cold polar regions would contain less water vapor, as would temperate regions in winter. Therefore, one estimate is that water vapor is responsible for about 60% of the ''natural greenhouse effect worldwide'' and that CO2 would be responsible for an estimated 20% (Singer & Avery, 2007: 40). However, the lack of any correlation of CO2 levels in air with air temperature in Figure 2 makes even the 20% figure doubtful. M.I.T. Professor Richard K. Lindzen credits water vapor and clouds with 98% of any ''greenhouse effect'' (Lindzen, 1992).
Fig. 7. Infrared spectrum of air at sea level, 760 torr, 288, relative humidity 76%, 29 June 1999. Absorbance vs. frequency in wavenumbers (cm-1) corresponding to wavelengths of 2.5–25 lm. Other experimental details in Kauffman (2004). Used with permission from The Journal of Chemical Education.
Lack of water vapor over deserts accounts for the greater disparity in day/ night temperatures (also called diurnal temperature range). Over non-deserts, water vapor and even clouds absorb and reradiate infrared, making the day/night difference less, as described in superior chemistry textbooks (Masterton & Hurley, 1989). It is possible that any human contribution to the feel of surface warming is from water vapor resulting from irrigation and the combustion of hydrogen-containing fuels (hydrocarbons or alcohols), which simply raise the humidity or dew point. Thus, the use of pure hydrogen as a fuel on a large scale could be counter-productive, especially if this fuel is made from hydrocarbons with CO2 as a by-product, sending additional water vapor into the air as well.
Electrolysis of water using solar or nuclear energy would not add any net new hydrogen to the atmosphere as water vapor or CO2.
Ice Core Records Before 1957
Zbignew Jaworowski, MD, PhD, DSc, of the Central Laboratory for Radiation Protection in Warsaw, Poland, has examined CO2 concentration data. According to Jaworowski, until 1985 the published CO2 concentrations in air bubbles in pre-industrial ice ranged from 160–700 ppm, with an occasional spike to 2450 ppm. After 1985, high readings disappeared from publications! Jaworowski gave a flagrant example of data selection from A. Neftel et al. (in Nature), who reported in 1985 that pre-industrial CO2 concentrations from a Byrd, Antarctica, ice core were 330–500 ppm (dots and bars in Figure 8). However, in 1988, also in Nature, and on the same core, only values of 290 ppm or less were reported, in agreement with the ''global warming'' hypothesis (gray areas in Figure 8) (Jaworowski, 1997).
Jaworowski also noted that air from ice at Summit, Greenland, deposited during the last 200 years ranged from 243–641 ppm in CO2. ''Such a wide range reflects artifacts caused by sampling, or natural processes in the ice sheet, rather than the variations of CO2 concentrations in the atmosphere''. G. I. Pearman et al., in a 1986 paper in Nature, rejected 43% of the CO2 readings, 39% of the methane readings, and 43% of the nitrous oxide readings from the Law Dome, Antarctica, core because they were higher or lower than the politically correct values, according to Jaworowski. They decided on a value of 281 ppm for CO2 in the pre-industrial period.
Air bubbles in a drilling core from 6000-year-old ice from Camp Century, Greenland, showed a CO2 concentration of 420 ppm, while it was 270 ppm in a supposedly 6000-year-old ice core from Byrd, Antarctica.
''New light was shed on the validity of the dating of recent ice strata when 6 U. S. [Lockheed] P 38 Lightning fighter planes and 2 B-17 [Boeing] Flying Fortresses from World War II were found buried in 1942 ice . . . in Greenland . . . where they had made . . . emergency landings. The planes were found 47 years later at a depth of 78 m, and not at the 12 m depth that had been estimated by glaciologists using oxygen isotope dating'' (Jaworowski, 1997). The examples above indicate that the ''experts'' do not know what age ice comes from drilling to any depth.
Now we go from biased selection of data to outright fraud. The CO2 concentrations in supposedly 19th century ice collected at Siple, Antarctica, were first reported as in Figure 9a, with a peak at 330 ppm in 1891. These data were arbitrarily moved to the right by assuming that the occluded air is 83 years younger than the ice its bubbles were found in! This gives the politically correct match with infrared measurements commenced in 1957 on the big island of Hawaii shown in Figure 9b. This is the basis for claims by the IPCC in its scary report of 1990, repeated incessantly by Warmers, that CO2 concentrations were around 280 ppm pre-industrially (before 1800) and have skyrocketed from 310 ppm in 1950 to an ''unprecedented'' 380 ppm in 1990 (Jaworowski, 1997, 2007). The ice core data are flawed by selection, contamination and diffusion, as well as some suspicious presentations; thus, they not useful.
Fig. 8. CO2 concentration in ice cores and the AGW Hypothesis. Neftel et al. in 1982 showed values up to 500 ppm (dots and bars). In 1988 the same authors published measurements for the same section of the Byrd ice core (gray areas), but left out all readings over 290 ppm.
Adapted from Jaworowski (1997).
Chemical Assays of CO2, 1812–1961
Chemists and others have been concerned for 200 years about accumulations of CO2. As early as 1812 it was possible to determine CO2 by weighing waterinsoluble metal (mostly calcium and barium) carbonates formed from their soluble hydroxides on exposure to air. From 1857–1961 a typical method was titration of the excess hydroxide after bicarbonates were formed by CO2 with potassium, sodium or barium hydroxide in water, a method still common before 1970 (Kolthoff et al., 1969). In more detail, a sample of metal hydroxide solution in excess of what was needed to react with the CO2 present in an air sample is allowed to form bicarbonate ion. The excess of hydroxide ion still present is titrated with standard acid. An unused amount of the metal hydroxide solution of exactly the same volume as was reacted with air is titrated with standard acid. The difference in volumes of standard acid used allows calculation of how much CO2 is present in the air sample.
Before pH meters, a phenolphthalein indicator was used, and the particular shade of pink at the endpoint of the titration was compared with that of a solution of pure sodium bicarbonate (pH Ľ 8.35). The air was normally dried by bubbling it through sulfuric acid to eliminate the effects of variable amounts of water vapor so that the results could be reported based on dried air. Loss of CO2 because of its solubility in sulfuric acid was recognized by 1847 as giving a low reading by 20 ppm. So the major error before then would have given low, not high, ppm values. Volumetric methods were sometimes used, in which a known volume of dry air was relieved of its CO2 and the volume shrinkage measured. An automated process of this type developed by Kreutz in Giessen, Germany, was used to compile 64,000 measurements. Chemists used pure samples of CO2 to check their work, and they compared results with each other. Several Nobel Prize winners were involved. About 90,000 individual determinations were logged among over 180 peer-reviewed papers (Beck, 2007).
Fig. 9. Altering the ice core data (open squares) to fit the AGW Hypothesis. Solid line is CO2 concentration in ppm in atmosphere from Mauna Loa. Original data in (a), arbitrary ''correction'' of 83 years in (b). Adapted from Jaworowski (1997, 2007).
Compared with the so-called pre-industrial levels of 280 ppm, a level of 410 ppm was found in 1812, rising to 450 ppm in 1825. There were levels of 370 ppm in 1857, and 4 sets of measurements gave 350–415 ppm around 1940 (Figure 10). From 1870–1920 values remained within 295–310 ppm. From 1955–1965 the values were 325 ppm. Beck chose the most carefully done assays for this graph. One was from Poona, India. An effort not described by Beck was one of 350 determinations near Point Barrow, Alaska, from 1947–1949, with a mean result of 420 ppm (Hock et al., 1952). The two non-European assays agree with the European ones of the same time period. Locations for many of these determinations were near the ocean or on islands, when practical. In general, the chemists would try to keep clear of any known CO2-emitting source.
Several of the chemists made plots of wind direction vs. CO2 levels, observing some directionality. From 1945–1965 world hydrocarbon use as fuel doubled (Robinson et al., 2007) as CO2 levels dropped from 415 to 325 ppm, so some other major source of CO2 had to exist.
Clearly there is no correlation of these actual measured CO2 levels with the ice core record. And there was no valid reason to dismiss most or all of them, yet this has been done. Jaworowski (1997) showed a diagram (Figure 11) based on the work of G. S. Callendar, a retired engineer and amateur meteorologist, who selected the '33 circled CO2 levels in Figure 11, while rejecting '6 that were lower and '60 that were higher. Other dismissals claim contamination from local carbon dioxide sources. The steady low levels shown in Fig. 10 from 1870–1920 and 1955–1965 counter this decisively.
NDIR Assays of CO2
Beginning in 1957, the Applied Physics Corp. of Pasadena, CA, introduced a non-spectrometric instrument (NDIR) for assay of gases from their infrared absorption. The infrared source was a Nichrome helix maintained at 5258C, and the beam of emitted infrared radiation was split between sample and reference chambers. The wavelengths of infrared were not given, and no optical filter was mentioned, so other gases in dry air could interfere, as could water vapor in wet air (Anon, 1957). The instrument must be calibrated frequently.
Possibly from around 1982 a Siemens Ultramat 3 NDIR was used. Air samples from the seemingly ideal location of Mauna Loa, Hawaii, at an altitude of 5 km, are obtained from towers 7 and 27 m tall, dried by being passed through a cold trap, and sent through the flow cell at 0.5 L/min. Every 30 minutes the sample is replaced by a stream of working reference gas. In December 1983 the CO2 in N2 standards used since 1957 were replaced by CO2 in air standards, which seems reasonable. Hourly averages of CO2 concentration, wind speed and direction are plotted as a basis for selecting data for further processing.
Steady hourly data within 60.5 ppm are sought for at least 6 hours per day. One wonders what might ''disturb'' these readings for the rest of the day. There was no mention of checking the cooled air for total removal of water vapor, nor of using an optical filter (Keeling & Whorf, 2005), but earlier citations were not checked. Methane (CH4) has a major absorption at 3.4 lm, CO2 at 4.26 lm and carbon monoxide (CO) at 4.7 lm. Unless a narrow-band filter is used, there could be interferences from these or water vapor.
The CO2 levels found at Mauna Loa range from 315 ppm in 1957 to 385 ppm in 2007, a period of 50 years. They are similar on Antarctica, showing good mixing of the atmosphere. Since there was a bigger rise from 312 to 415 ppm from 1927–1944 (27 years), shown by chemical assays as described above (Figure 10), there should be no reason for alarm at present. The start of the infrared data in 1958 showed a CO2 concentration that was 12 ppm lower by NDIR assay than the best chemical data of the period. The chemical data are very consistent with each other. This discrepancy has never been resolved.
Fig. 10. Local CO2 concentrations in northern hemisphere from 1812–1961 by chemical assay. Data smoothed by use of 11-year average. Numbers between vertical arrows show number of measurement campaigns. Important analysts with time period of assays are shown in dark gray and black. Adapted from Beck (2007).
During the period of chemical assays, several different workers made measurements of CO2, yet now there is only the single type of assay with a single research group and mostly in a single location. With costs in the trillions of dollars being threatened for reducing emissions of CO2, it should be obvious that some confirmatory assays should be made under independent auspices and in other locations.
Whence Cometh the CO2?
More than one estimate indicates that the anthropogenic contribution to the present CO2 level is 4%, or 15 ppm (Jaworowski, 1997). Increases in CO2 level in the past 100 years appear to follow rather than precede the slight surface warmings (Beck, 2007; Jaworowski, 2007). Since there is 50 times as much CO2 dissolved in the oceans as there is in the atmosphere at present, one must examine the known relationship of temperature and gas solubility in water. During the Little Ice Age and later, say 1700–1850, the lower temperatures meant that more CO2 would have dissolved in sea water, according to Robert Bunsen's measurements around 1850, and many more since. This is not a trivial difference, since 20% more CO2 dissolves in water at 158C than at 208C (Partington, 1957).
Therefore, steady concentrations of CO2 in air before about 1900, as claimed by Warmers, are unlikely. When ocean temperatures become warmer, less CO2 can be retained in the upper 3000-m layer of oceans, and it is exhaled into the atmosphere. Mean global ocean temperatures would have been valuable, but only the surface temperatures have been measured, so far as I could find, and mostly in the northern hemisphere. Recent measurements by satellite do not go back far enough.
Fig. 11. Means (dots) of local CO2 concentrations in northern hemisphere from 1812–1961 by chemical assay. Values that G. S. Callendar chose to use in 1938 for AGW Hypothesis are shown encircled. Higher and lower values were ignored. Adapted from Jaworowski (1997).
The most persuasive record I could find ran from 1900–1987 in the North Atlantic from 0–708 north latitude. From 0–608 north, the period from 1905–1940 showed about 18 of warming, then steady or dropping temperatures.
The 60–708 north record showed about 1.88 of warming from 1922–1960, with sinking temperatures thereafter (Kushnir, 1994). This is the reason why the chemical assays registered a large increase in atmospheric CO2, from 295 ppm in 1885 to 440 ppm in 1944 (Figure 10). Ocean cooling of '0.68 from 1940–1970 (Kushnir, 1994) brought CO2 levels down for a while to 325 ppm from 1955–1965 (Figure 10). At least 4 studies showed that the southern hemisphere did not warm up so much (Singer & Avery, 2007: 39), as did 1 study by Endersbee (2007a). The prevailing winds in the North Atlantic, from 40–708 north at least, blow over Europe and were the source of air used in most of the chemical assays (Beck, 2007).
What could possibly warm up the oceans regionally besides solar energy? Undersea volcanoes are familiar around Hawaii and Iceland. Visible clouds of steam form. The CO2 in the area is not visible, unlike the steam clouds. New Hawaiian islands are being formed by undersea volcanoes southeast of the Big Island, with inevitable emission of CO2 from the ocean in that area. Extensive ocean hot spots of .18 increase lasting for months have been mapped, many in the Pacific Ocean, some near Hawaii (Goreau & Hayes, 1994). Perhaps Mauna Loa was not an ideal location after all. Endersbee (2007b) quoted a 2001 press release from the National Science Foundation: ''Contrary to their expectations, scientists on a research cruise to the Arctic Ocean have found evidence that the Gakkel Ridge . . . may be very volcanically active.
A few years ago a submarine exploration of the Arctic Ocean under the polar ice cap found some 15 large geothermal vents along the Arctic fracture zone, and evidence of the recent outflow of lava. 'We found more hydrothermal activity on this cruise than in 20 years of exploration on the mid-Atlantic Ridge', said Charles Langmuir, scientist from [the] Lamont-Doherty Earth Observatory at Columbia University''. Thus, AGW is not needed to explain arctic ice melting.
The ''hockey stick'' graph of CO2 vs. time is as unlikely as the ''hockey stick'' of temperature vs. time. And so the AGW Hypothesis is shown to be disproven based on the poor correlation of both the conventional and chemical CO2 records with the temperature record, but CO2 levels by chemical assay are found to rise after a temperature rise.
What Causes Most Climate Change?
This section will be very brief compared with the sections above because the main purpose of this essay was to show what is known about the falsifiability of the AGW Hypothesis, and that has been accomplished above.
More sunspots and longer periods of more sunspots indicate greater solar magnetic activity, which shields the Earth from some cosmic rays, causing less cloud formation and thus warming (Svensmark & Calder, 2007). The Maunder Minimum in sunspots occurred from 1640–1710, when there were few or no sunspots for 70 years. This corresponds well with the coldest period of the Little Ice Age (Singer & Avery, 2007, p. 8). A correlation of sunspot activity and rainfall in South Africa has been made for most of the 20th century. There is an almost 3-fold sudden increase in the annual flows in the Vaal River during the 3 years previous to a sunspot maximum compared with the 3 years subsequent to a sunspot maximum. This was directly associated with a 6-fold increase in sunspot numbers, from 25–60 spots at minima to 250–400 spots at maxima.
Numbers of sunspots in maxima have increased throughout the 20th century, indicating a warming sun (Alexander et al., 2007).
The Earth does not orbit with the sun at one of the foci of the orbital ellipse, but it actually orbits the center of gravity of the solar system. When the Earth's orbit reaches an extreme eccentricity, as in 1993, it was 3,700,000 km closer to the sun in January than in June. The received wattage in January was calculated as 1417 W/m2 and in June 1350 W/m2, for a difference of 67 (5%), far greater than the IPCC Report of 2001 states: 0.3 W/m2, a 200-fold difference (Alexander et al., 2007). According to Prof. Robert C. Balling, Jr., former Director of the Office of Climatology at Arizona State University, a rise of 3 W/m2 in received solar radiation will increase the surface temperature by 0.78C. Indeed, this was the increase in received solar radiation from 1900–1990 (Michaels, 2004: 60–61, 210–233). It is in good agreement with the 0.6–18C rise estimated for 1900–2007.
During longer sunspot cycle lengths, the Earth's magnetic field weakens, and cosmic rays in greater numbers penetrate the troposphere, causing high cloudiness and low, wet clouds that cool the Earth that form by cloud seeding (nucleation) (Michaels, 2004: 62–63; Singer & Avery, 2007: 9).
During the Little Ice Age, actually from 1610–1715, there were almost no sunspots. A linear best fit (smoothed) graph of sunspot numbers from 1750–2007 showed 39 spots in 1750, rising to 66 in 2007, demonstrating a more active sun (Endersbee, 2007b).
Ten mainstream scientists (including the late Gerard Bond) at Columbia University, the Heidelberg Academy of Sciences, the University of Arizona, North Carolina State University and the ETH in Zurich produced a massive collection of their own findings entitled ''Persistent Solar Influence on North Atlantic Climate During the Holocene''. Their evidence comes from a close correlation between changes in production rates of the cosmogenic nuclides carbon-14 and beryllium-10 and centennial to millennial time-scale proxies of drift ice measured in deep-sea sediment cores. A solar-controlled mechanism may underlie at least the Holocene segment, 11,500 years ago to the present, of the North Atlantic's 1500-year cycle.
''Our findings support the presumption that solar variability will continue to influence climate in the future, which up to now has been based on extrapolation of evidence from only the last 1000 years . . .'' (Bond et al., 2001). Climate variability is fundamentally linked to solar output. Richard Willson, affiliated with both Columbia University and NASA, reported that the sun's radiation has increased by nearly 0.05% per decade since the late 1970s. Willson used data from three different NASA ACRIM satellites monitoring the sun to assemble a twenty-five-year record of total solar irradiation from 1978 to 2003. The trend is significant because the sun's total energy output is so huge. A variation of 0.05 percent in its output is equal to all human energy use. (Singer & Avery, 2007, p. 192)
Ad Hominem
In few fields considered to be science-based has there been such a high degree of polarization and refusal to consider alternate explanations of natural phenomena as in climate change at present. Warmers accuse Skeptics of being paid by hydrocarbon energy companies, and Skeptics accuse Warmers of doing anything for grant funding. Ernst-Georg Beck (by e-mail) and I affirm that we have no financial conflict.
Beck's recent uncovering of the 1812–1961 CO2 record is not unique nor the effort of an eccentric (Beck, 2007). G. Slocum published on it in 1955; F. S. K. Fonselius and K.-E. Warme in 1956, and Z. Jaworowski et al. in 1992 (Jaworowski, 2007). Beck's paper has been criticized by Georg Hoffman, who wrote that the fluxes of CO2 needed to give some of the high values are unimaginably high. This is easily countered by my calculation that if all the CO2 in the oceans were released, the level in air would then be about 20,000 ppm. As given above, an 18 rise in the North Atlantic Ocean was followed by a 115 ppm rise in CO2. from 1925–1945. Hoffman cited CO2 assays in 2003 in his hometown of Paris of 425, 430, 508 and 542 ppm as a supposed example of why older measurements carried out with no or few cars present and away from known CO2 sources must be wrong. Hoffman cites ice core data in ignorance that it is hopeless for the reasons cited above and excoriates Beck's paper's peer reviewers and the journal (Hoffman, 2007).
The scenario seems to be that between 1985 and 1988, a decision was made to present pre-1958 CO2 concentrations with no humps or dips and to proclaim a pre-industrial level of 280 ppm. Nevertheless, the IPCC Report of 1990 presented a very reasonable reconstruction of temperatures for the past 11,000 years (Figure 12). It seems obvious that the 4 warm (and several cool) periods shown, which are supported by evidence given above, should have called for correspondingly higher (or lower) CO2 concentrations according to the AGW Hypothesis. The IPCC Report of 1995 also showed the Little Ice Age and the Medieval Warm Period (Singer & Avery, 2007: p. 68). So this non-correlation had to be resolved by altering the CO2 record or the temperature record. The latter was chosen by a number of workers, so Michael Mann's ''hockey stick'' of 1998 appeared in the IPCC Report of 2001, and has been identified as a fraud by many workers, as noted above. It is symptomatic of the Warmer's outlook (thermocephaly?) that Mann's temperature reconstruction continues to be shown as gospel, even though it is gone from the 2007 IPCC Report.
Fig. 12. Global temperature variations for last 10,000 years. Composite of proxies from 1990 IPCC Report, as seen in Jaworowski (2007).
An entire book appeared, Shattered Consensus, for the sole purpose of revealing flaws in the 2001 IPCC Report (Michaels, 2004). In the case of Michael Mann, two Canadians, Chris Essex and Ross McKitrick, asked for raw data from Mann, which was provided incompletely and grudgingly, and they were able to reproduce Mann's graph partially from the output of a random number generator. Mann also gave great weight to tree ring widths in a single California location without adequate adjustment for rain or for CO2 as a fertilizer. Methods in an Appendix to Mann's paper in Nature were obscure to say the least. Essex and McKitrick informed the editor of Nature, where Mann had published, who demanded a ''correction of error'', which appeared in the 1 July 2004 issue. This corrigendum was incomplete and introduced new errors (Essex & McKitrick, 2002: 154–174; Michaels, 2004: 1–49; Singer & Avery, 2007: 68–71).
One of the IPCC scientists who worked on the 2001 Report, Prof. John Christy, University of Alabama, noted that an obvious bias was present among the lead authors (he was one), 80% of whom clearly supported the Kyoto Protocol for limiting anthropogenic CO2 emissions. ''Given that situation, it is not too difficult to locate sections in IPCC 2001 that appear to withhold the scientific objectivity that could detract from a view that dangerous climate change was a certainty, as projected by the models''. Christy cited the Report's predictions of northern hemisphere sea ice retreat as evidence of valid models of warming and the absence in the Report of southern hemisphere data, which Christy found were opposite, thus invalidating the IPCC model (Michaels, 2004, pp. 74–75). In addition, it seems the IPCC does not recognize warming from arctic undersea volcanoes (see above).
What about the claim of the . . . IPCC that they've found a ''human fingerprint'' in the current global warming? That statement was inserted in the executive summary of the IPCC's 1995 report for political, not scientific reasons. Then the ''science volume'' was edited to take out five different statements—all of which had been approved by the panel's scientific consultants—specifically saying no such ''human fingerprint'' had been found. The author of the IPCC science chapter, a U.S. government employee, publicly admitted making the scientifically indefensible 'back room' changes. He was under pressure from top U.S. government officials to do so. (Singer & Avery, 2007, pp. 9–10)
The concern at the top about ''climate change'' is not genuine, and there are hidden motives behind the global warming hysteria. Maurice Strong, . . . who was partially responsible for putting together the Kyoto Protocol . . . stated: ''We may get to the point where the only way of saving the world will be for industrial civilization to collapse''. Timothy Wirth, U.S. Undersecretary of State for Global Issues . . . [said]: ''We have got to ride the global warming issue. Even if the theory of global warming is wrong, we will be doing the right thing in terms of economic policy and environmental policy''. Richard Benedick, a Deputy Assistant Secretary of State . . . stated: ''A global warming treaty must be implemented even if there is no scientific evidence to back the [enhanced] greenhouse effect''. (Jaworowski, 1999)
In the Summary for Policymakers of the IPCC 2007 Report, the now ubiquitous litany of false claims continues: (1) That human-made CO2 caused the natural [sic] range of 180–300 ppm over the last 650,000 years to be exceeded; (2) that human acts since 1750 warmed the climate; (3) that the warmth of the last half century is the highest in the last 1300 years and that human CO2 was ''very likely'' to have done it; and (4) that by the end of the 21st century the surface temperature will increase by 1.18 to 6.48 (Jaworowski, 2007). All 4 points are at odds with the data given above.
Serious predictions have been made by Warmers that global warming will cause both warming and cooling, both droughts and floods, sea level increases, and the Gulf Stream to shut down. The idea is to cover all eventualities. In remarks to the Commonwealth Club, San Francisco, 15 September 2003, Michael Crichton, MD, spoke of ''Eden, the fall of man, the loss of grace, the coming doomsday—these are deeply held mythic structures . . .. These are issues of faith . . .. And so it is, sadly, with environmentalism. Increasingly it seems facts aren't necessary, because the tenets of environmentalism are all about belief.
It's about whether you are going to be a sinner, or saved. Whether you are going to be one of the people on the side of salvation, or on the side of doom. Whether you are going to be one of us, or one of them'' (Crichton, 2003).
An evil result of CO2 mania was the beginning of carbon trading. ''The idea was that if business A can reduce emissions more cheaply than business B, then B can pay A to make reductions for both of them''. Big polluters are able to buy cheap ''offset'' credits from abroad (Lohmann, 2006). No real reduction in CO2 emissions results, but carbon emission trading companies can make big profits, so some Warmers support the scheme, but others do not. The staggering costs of proposed limitations on CO2 emissions will degrade standards of living worldwide.
''The control of [the resulting] societal instability may very well be the real challenge facing us'' (Lindzen, 1992).
Sometimes shamed by contradictory data, Warmers have gone so far as to accuse Skeptics of being in the same class as Holocaust deniers. A good response is to remind them of another NAZI-era precept: ''All propaganda has to be popular and has to adapt its spiritual level to the perception of the least intelligent of those towards whom it intends to direct itself''. ''In the size of the lie there is always contained a certain factor of credibility, since the great masses of the people . . . will more easily fall victim to a great lie than a small one'' (Hitler, 1933).
Conclusions
The AGW Hypothesis is not supported by surface temperature records of the last 250 years or by climate proxies of the greatest number and credibility from the past 1000 years, or by recent surface measurements in rural areas, or by atmospheric temperatures.
The most commonly presented temperature proxy record, that of Michael Mann, was shown to be seriously flawed. The Earth's surface has warmed about 0.6–18 since 1900, including parts of the Atlantic Ocean. The troposphere has warmed erratically by about 0.28 since 1979, with no correlation with CO2 levels. The period from 1000–1400 saw temperatures, based on many proxies, as high or slightly higher than now. The Little Ice Age saw surface temperatures about 18 lower than in 1900, or 28 lower than now. Only very large metropolitan areas had increases in the 3–48 range. The 1930s were warmer than the 1990s.
The most commonly presented pre-1958 CO2 proxy records, ice core data, were shown to be erratic. Direct chemical assay from 1812–1965 cannot be ignored. The pre-1957 level of CO2 was certainly not 290 ppm in air, but it was higher during several portions of the period from 1812–1965 (415 ppm in 1940).
Ocean temperature increases that were found seem to have preceded the increases in CO2 levels and may have been the source. The predominant greenhouse gas is water vapor, not CO2. More water vapor also limits the day/night temperature range.
Many flaws have been found in the IPCC Reports, which should have been the most definitive sources on climate change and predictions, but were not. Surreptitious late changes in the Reports were not appreciated by many of the scientists who contributed. The claimed consensus on climate change from the AGW Hypothesis does not exist. Forced limits on CO2 emissions will not be productive and will cause serious drops in living standards in industrialized countries, if adopted. The reputation of scientists and Science may be irreparably harmed by reports of misconduct and waste of tax revenues in promotion of the AGW Hypothesis, and this may carry over to scientific fields beyond climate change.
None of this should be construed as condoning wasteful use of hydrocarbon fuels. For the obvious economic reasons, not an unthreatening global warming, hydrocarbon fuels should be conserved or substituted when possible.
Acknowledgments
Anne M. Klinkner, BS, directed my attention to ocean temperatures. Frances E. H. Pane, MSLS, edited the manuscript.
References
Alexander, W. J. R., Bailey, F., Bredenkamp, D. B., van der Merwe, A., & Willemse, N. (2007). Linkages between solar activity, climate predictability and water resource development. Journal of the South African Institution of Civil Engineering, 49(2), 32–44 (Paper 659).
Anon. (1957). Infra-red gas analyser. Journal of Scientific Instruments, 34, 77.
Bauer, H. H. (2004). Science in the 21st Century: Knowledge monopolies and research cartels. Journal of Scientific Exploration, 18, 643–660.
Beck, E.-G. (2007). 180 Years of atmospheric CO2 gas analysis by chemical methods. Energy and Environment, 18(2), 259–282.
Bond, G., Kromer, B., Beer, J., et al. (2001). Persistent solar influence on North Atlantic climate during the Holocene. Science, 294, 2130–2136.
Brahic, C., Chandler, D. L., Le Page, M., McKenna, P., & Pearce, F. (2007). Climate myths. New Scientist, 19 May, 34–42.
Christy, J. R., & Goodridge, J. D. (1995). Precision global temperatures from satellites and urban warming effects of non-satellite data. Atmospheric Environment, 29, 1957–1961. In Singer, S. F. (1999). Hot Talk Cold Science (p. 47). Oakland, CA: The Independent Institute.
Christy, J. R., Norris, W. B., Spencer, R. W., & Hnilo, J. J. (2007). Tropospheric temperature change since 1979 from tropical radiosonde and satellite measurements. Journal of Geophysical Research, 112, D06102; doi:10.1029/2005JD006881.
Crichton, M. (2003). Available at : http://www.michaelcrichton.com/speechenvironmentalismaseligion.html. Accessed 3 February 2007.
Endersbee, L. (2007b). Climate change is nothing new! New Concepts in Global Tectonics Newsletter, 42. Available at: http://www.ncgt.org/category.php?idĽ13. Accessed 14 August 2007.
Essex, C., & McKitrick, R. (2002). Taken by Storm. Toronto, Ontario, Canada: Key Porter Books. pp. 154–174.
Goodridge, J. D. (1996). Comments on regional simulation of greenhouse warming including natural variability. Bulletin of the American Meteorological Society, 77, 3–4. In Singer, S. F. (1999). Hot Talk Cold Science (p. 13). Oakland, CA: The Independent Institute.
Goreau, T. J., & Hayes, R. L. (1994). Coral bleaching and ocean ''hot spots''. Ambio (Stockholm), 23(3), 176–180.
Hitler, A. (1933). Mein Kampf (1923, English translation, 1933), as seen in Bartlett, J. (1955). Bartlett's Familiar Quotations (13th ed.). Boston: Little Brown & Co. p. 951.
Hock, R. J., Erikson, H., Flagg, W., Scholander, P. F., & Irving, L. (1952). Composition of the ground-level atmosphere at Point Barrow, Alaska. Journal of Meteorology, 9, 441–442.
Hoffman, G. (2007). Beck to the future. Available at: http://www.realclimate.org/index.php/archives/2007/05/beck-to-the-future/. Accessed 27 July 2007.
IPCC (2007). Climate Change 2007: The Physical Science Basis. Summary for Policymakers. Contribution of Working Group I to the Fourth Assessment Report of the Intergovernmental Panel on Climate Change. Available at: http://www.ipcc.ch/SPM2feb07.pdf. Accessed 22 September 2007.
Jaworowski, Z. (1994). Ancient atmosphere—Validity of ice records. Environmental Science and Pollution Research, 1(13), 161–171.
Jaworowski, Z. (1997). Ice core data show no carbon dioxide increase. Available at: http://www.21stcenturysciencetech.com under the topic ''Global Warming''. Accessed 30 June 2007.
Jaworowski, Z. (1999). The global warming folly. 21st Century Science and Technology, 12(4),64–75.
Jaworowski, Z. (2003). Solar cycles, not CO2, determine climate. 21st Century Science and Technology, Winter 2003–2004, 52–65. Available at: http://en.wikipedia.org/wiki/Zbigniew_Jaworowski or at: http://www.21stcenturysciencetech.com/. Accessed as PDFs on 5 July 2007.
Jaworowski, Z. (2007). CO2: The greatest scientific scandal of our time. EIR Science, 16 March, 38–53. Available at: http://www.21stcenturysciencetech.com/. Accessed 5 July 2007.
Kahl, J. D., Charlevoix, D. J., Zaitseva, N. A., Schnell, R. C., & Serveze, M. C. (1993). Absence of evidence for greenhouse warming over the Arctic Ocean in the past 40 years. Nature, 361(6410), 335–337.
Kauffman, J. M. (2004). Water in the atmosphere. Journal of Chemical Education, B81(8), 1229–1230.
Keeling, C. D., & Whorf, T. P. (2005). Atmospheric carbon dioxide record from Mauna Loa. Available at: http//cdiac.ornl.gov/trends/co2/sio-mio.htm. Accessed 15 July 2007.
Kolthoff, I. M., et al. (1969). Quantitative Chemical Analysis (4th ed.). London: Macmillan. pp. 704–705, 786–787.
Kushnir, Y. (1994). Interdecadal variations in North Atlantic sea surface temperature and associated atmospheric conditions. Journal of Climate, 7, 141–157.
Lindzen, R. S. (1992). Global warming: The origin and nature of the alleged scientific consensus. Available at: http://www.cato.org/pubs/regulation/regv15n2/reg15n2g.html. Accessed 7 September 2007.
Lohmann, L. (2006). Carry on polluting. New Scientist, 2 December, 18.
Masterton, W. L., & Hurley, C. N. (1989). Chemistry: Principles and Reactions. Philadelphia: Saunders. pp. 655–656, 663–666.
McIntyre, S., & McKitrick, R. (2005). Hockey sticks, principal components, and spurious significance. Geophysical Research Letters, 32, L03710; doi:10.1029/2004GL021750.
Michaels, P. J. (ed.). (2004). Shattered Consensus: The True State of Global Warming. Lanham, MD:Rowan & Littlefield.
Mitchell, J. (2007). Climate change myths. Available at: http://www.metoffice.gov.uk/corporate/pressoffice/myths/index.html. Accessed 3 August 2007.
Oerlemans, J. (2005). Extracting a climate signal from 169 glacier records. Science, 308, 675–677.
Partington, J. R. (1957). A Text-Book of Inorganic Chemistry. London: Macmillan. p. 65.
Robinson, A. B., Robinson, N. E., & Soon, W. (2007). Environmental effects of increased atmospheric carbon dioxide. Journal of American Physicians and Surgeons, 12, 79–90.
Robock, A. (2000). Volcanic eruptions and climate (Rutgers University, New Brunswick, NJ, USA). Reviews of Geophysics, 38(2), 191–192. Available at: http://climate.envsci.rutgers.edu/pdf/ROG2000.pdf. Accessed 3 August 2000.
Singer, S. F., & Avery, D. T. (2007). Unstoppable Global Warming Every 1,500 Years. Lanham, MD: Roman & Littlefield.
Soon, W., & Baliunas, S. (2003). Proxy climatic and environmental changes of the past 1000 years. Climate Research, 23, 89–110.
Svensmark, H., & Calder, N. (2007). The Chilling Stars. A New Theory of Climate Change. Cambridge, England: Icon Books.
Winchester, S. (2003). Krakatoa. The Day the World Exploded: August 27, 1883. New York:HarperCollins. pp. 288–293.